

"Enabled" cache does not prove cache is healthy
Magento stores usually have caching enabled. That status does not prove the cache is serving many requests. A status command cannot show the full picture.
A cache can be enabled and configured correctly, yet still have a low hit rate. That sends most requests to the origin at the full application cost.
This article explains how to check the cache configuration, measure the real hit rate, and find two common causes of a low rate.
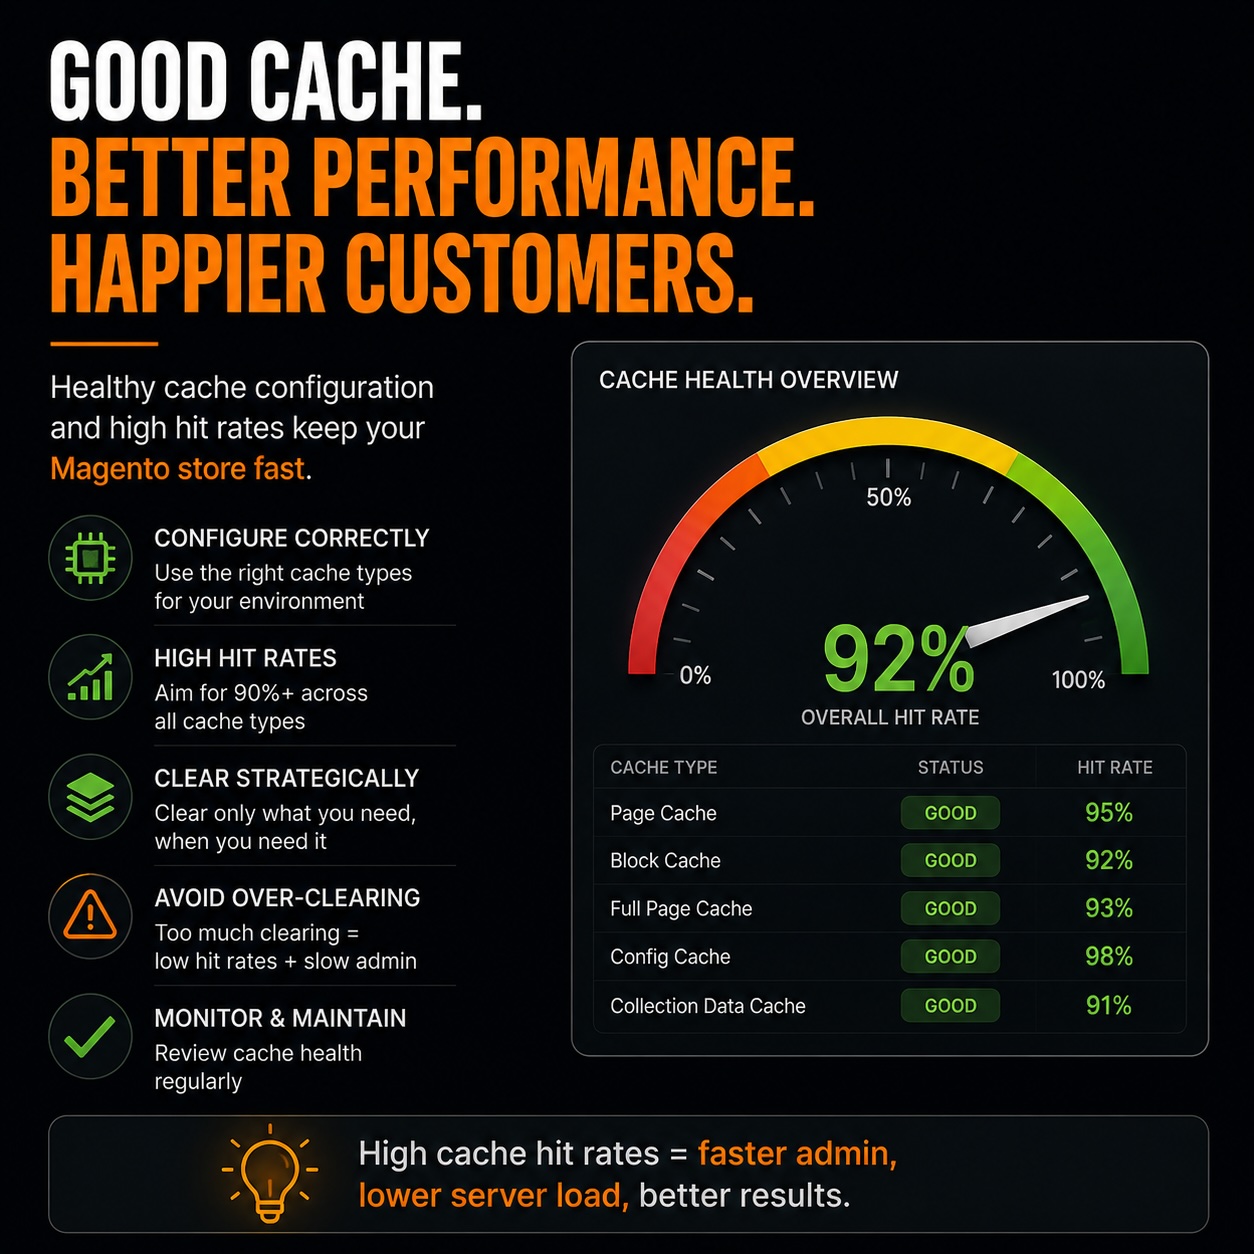
What a healthy cache stack contains
A Magento cache stack has several layers. Each layer handles a different type of data:
- Full-page cache, served by Varnish in front of the application for production stores.
- The default cache plus the block, layout, and config caches, backed by Redis or Valkey instead of the filesystem.
- Sessions stored in Redis instead of the database or local disk.
When these layers are set up correctly, the application does less work for each request. If they share the filesystem or use the wrong settings, the store pays the cost of requests the cache should have served.
Check the configuration first
Start with the settings Magento is using. bin/magento cache:status shows which cache types are enabled. All required cache types should be enabled in production.
Check the full-page cache backend with bin/magento config:show system/full_page_cache/caching_application. A value of 1 means the built-in PHP cache. A value of 2 means Varnish. A production store that returns 1 is missing the performance benefits of Varnish.
Next, confirm the Redis settings in app/etc/env.php. The default cache, page cache, and sessions should use separate Redis databases instead of sharing one. With a shared database, a targeted cache flush can clear unrelated data.
Measure the real hit rate
Configuration shows that a cache exists. The hit rate shows how often it serves a request. You must measure the hit rate directly.
A cache hit is served from cache. A cache miss requires the application or the origin to do the work. For Varnish, varnishstat reports cache_hit and cache_miss in real time. For Redis, redis-cli info stats exposes keyspace_hits and keyspace_misses.
Why full-page cache hit rates fall
A low full-page cache hit rate often comes from blocks that opt out of caching. A single block marked cacheable="false" in layout XML makes the page uncacheable. One extension can apply this setting to an important template.
Short time-to-live settings can also lower the rate. So can too many customer-specific sections. Varnish cannot serve a page from shared cache when the page changes for each customer.
Audit the layout XML for cacheable="false". Then review the blocks placed in private, per-customer sections and remove that setting where the data does not need to be private.
Redis eviction lowers cache hit rates
Another common cause is a Redis instance that is too small for the data the store needs to hold. When Redis reaches its maxmemory limit, it evicts keys to make room. A removed cache entry becomes a miss the next time someone requests it.
Check evicted_keys in redis-cli info stats. A steadily rising count means Redis is filling up and removing entries before they can be reused. That pattern can explain a low hit rate that the Magento configuration does not explain.
The fix may require more memory for Redis or a suitable maxmemory-policy. The eviction count tells you whether Redis has enough room to work.
OPcache also affects response time
Magento's application caches are only part of the performance picture. PHP's OPcache stores compiled bytecode, which is the prepared form of PHP code. On a large Magento codebase, OPcache affects response time.
Confirm that OPcache is enabled and sized for the codebase. When opcache.memory_consumption is too small, PHP evicts compiled code and recompiles it during later requests. That repeats work the server should be able to reuse.
OPcache is outside bin/magento cache:status. A cache review that checks only Magento's status output will miss an OPcache problem.
Cache status is not cache health
Cache health requires measurement. An enabled cache with a poor hit rate can send almost as much work to the origin as no cache at all, while still looking correct in the status output.
Record the real hit rates and investigate what lowers them. That gives the performance review a measurable starting point before deeper work on the origin.